ClickHouse安装及简单使用(一)
ClickHouse是近年来备受关注的开源列式数据库,主要用于数据分析(OLAP)领域,很多大厂都在使用,网上介绍的文章一搜有很多就不过介绍了。
官网文档:https://clickhouse.com/docs/en/architecture/introduction
一、ClickHouse单机安装
# grep -q sse4_2 /proc/cpuinfo && echo "SSE 4.2 supported" || echo "SSE 4.2 not supported" #检查当前CPU是否支持SSE 4.2的命令
SSE 4.2 supported
1.1 yum安装
#yum install -y yum-utils
#yum-config-manager --add-repo https://packages.clickhouse.com/rpm/clickhouse.repo
#yum install -y clickhouse-server clickhouse-client
#/etc/init.d/clickhouse-server start
1.2 rpm安装
#wget https://packages.clickhouse.com/rpm/stable/clickhouse-client-24.6.2.17.x86_64.rpm
#wget https://packages.clickhouse.com/rpm/stable/clickhouse-common-static-24.6.2.17.x86_64.rpm
#wget https://packages.clickhouse.com/rpm/stable/clickhouse-common-static-dbg-24.6.2.17.x86_64.rpm
#wget https://packages.clickhouse.com/rpm/stable/clickhouse-server-24.6.2.17.x86_64.rpm
#rpm -ivh clickhouse-common-static-24.6.2.17.x86_64.rpm
#rpm -ivh clickhouse-common-static-dbg-24.6.2.17.x86_64.rpm
#rpm -ivh clickhouse-server-24.6.2.17.x86_64.rpm
#rpm -ivh clickhouse-client-24.6.2.17.x86_64.rpm
#/etc/init.d/clickhouse-server start
1.3 Tgz安装
如果你的操作系统不支持安装deb或rpm包,建议使用官方预编译的tgz软件包。所需的版本可以通过curl或wget从存储库https://packages.clickhouse.com/tgz/下载。
下载后解压缩下载资源文件并使用安装脚本进行安装。以下是一个最新稳定版本的安装示例:
LATEST_VERSION=$(curl -s https://packages.clickhouse.com/tgz/stable/ | \
    grep -Eo '[0-9]+\.[0-9]+\.[0-9]+\.[0-9]+' | sort -V -r | head -n 1)
export LATEST_VERSION

case $(uname -m) in
  x86_64) ARCH=amd64 ;;
  aarch64) ARCH=arm64 ;;
  *) echo "Unknown architecture $(uname -m)"; exit 1 ;;
esac

for PKG in clickhouse-common-static clickhouse-common-static-dbg clickhouse-server clickhouse-client
do
  curl -fO "https://packages.clickhouse.com/tgz/stable/$PKG-$LATEST_VERSION-${ARCH}.tgz" \
    || curl -fO "https://packages.clickhouse.com/tgz/stable/$PKG-$LATEST_VERSION.tgz"
done
tar -xzvf "clickhouse-common-static-$LATEST_VERSION-${ARCH}.tgz" \
  || tar -xzvf "clickhouse-common-static-$LATEST_VERSION.tgz"
sudo "clickhouse-common-static-$LATEST_VERSION/install/doinst.sh"

tar -xzvf "clickhouse-common-static-dbg-$LATEST_VERSION-${ARCH}.tgz" \
  || tar -xzvf "clickhouse-common-static-dbg-$LATEST_VERSION.tgz"
sudo "clickhouse-common-static-dbg-$LATEST_VERSION/install/doinst.sh"

tar -xzvf "clickhouse-server-$LATEST_VERSION-${ARCH}.tgz" \
  || tar -xzvf "clickhouse-server-$LATEST_VERSION.tgz"
sudo "clickhouse-server-$LATEST_VERSION/install/doinst.sh" configure
sudo /etc/init.d/clickhouse-server start

tar -xzvf "clickhouse-client-$LATEST_VERSION-${ARCH}.tgz" \
  || tar -xzvf "clickhouse-client-$LATEST_VERSION.tgz"
sudo "clickhouse-client-$LATEST_VERSION/install/doinst.sh"
对于生产环境,建议使用最新的stable版本。你可以在GitHub页面https://github.com/ClickHouse/ClickHouse/tags找到它,它以后缀`-stable`标志。
二、跟着官网学习一些Deploying的知识
2.1 Terminology(术语)
Replica(副本)
数据副本。ClickHouse始终至少有一个数据副本,因此副本的最小数量为一个。这是一个重要的细节,你可能不习惯将数据的原始副本视为副本,但这是ClickHouse代码和文档中使用的术语。添加数据的第二个副本可以提供容错性。
Shard(分片)
数据的子集。ClickHouse总是至少有一个数据分片,所以如果你不在多个服务器上分割数据,你的数据将存储在一个分片中。如果你超过了单个服务器的容量,则可以使用跨多个服务器的分片数据来分担负载。目标服务器由分片键决定,并在创建分布式表时定义。分片键可以是随机的,也可以作为哈希函数的输出。涉及分片的部署示例将使用rand()作为分片键,并将提供有关何时以及如何选择不同分片键的进一步信息。
Distributed coordination(分布式协调)
ClickHouse Keeper为数据复制和分布式DDL查询的执行提供了协调系统。ClickHouse Keeper与Apache ZooKeeper兼容。
2.2 Scaling out(扩展)
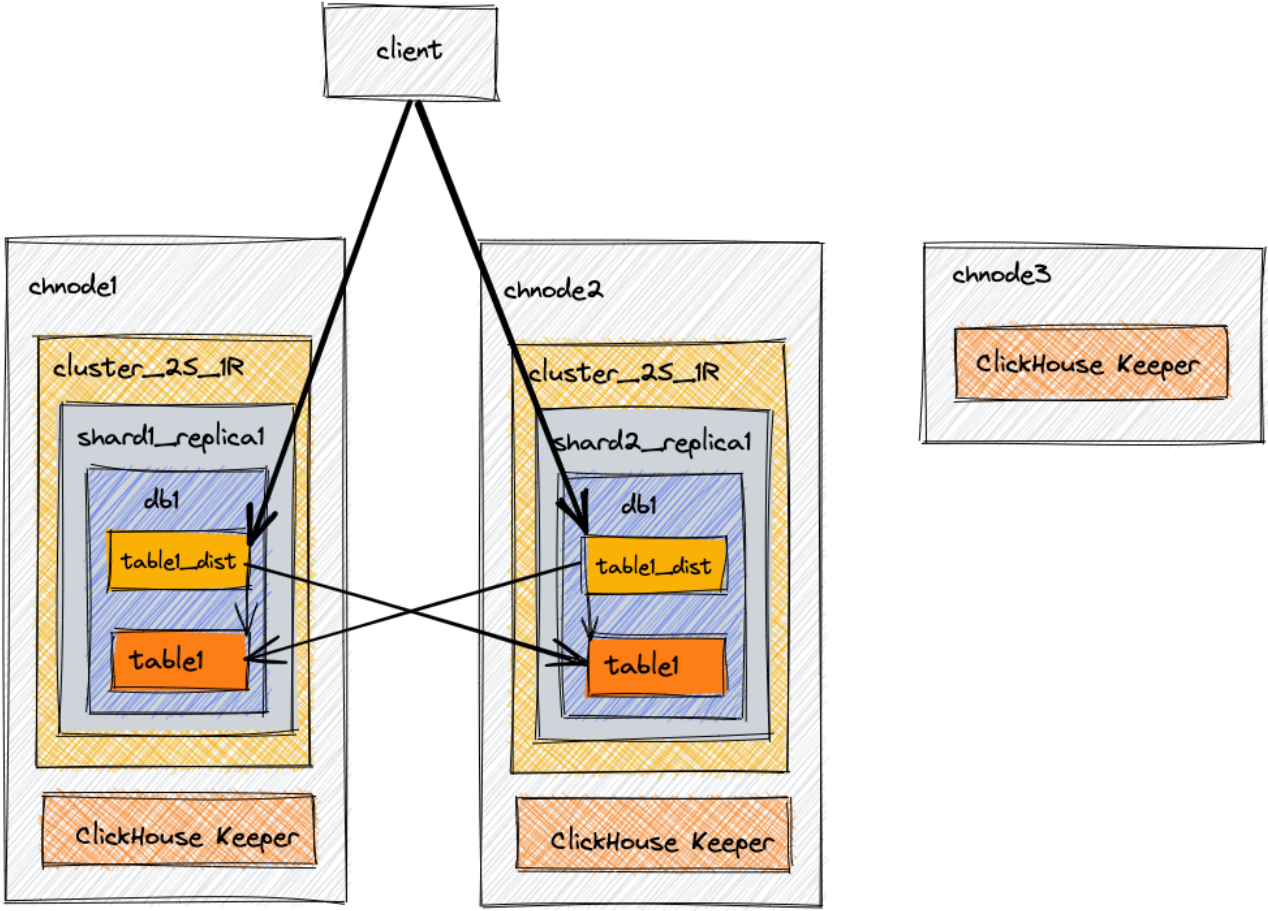
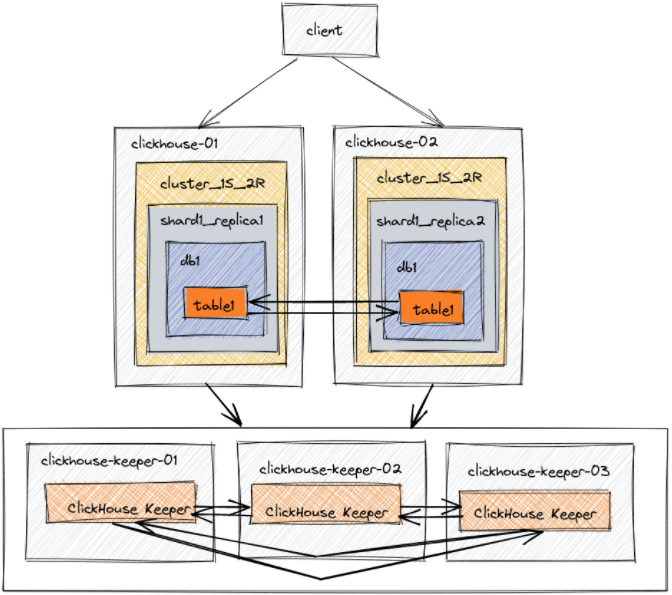
此示例架构旨在提供可扩展性。它包括三个节点:两个组合的ClickHouse+协调(ClickHouse Keeper)服务器,以及一个只有ClickHouse Keeper的第三个服务器以完成三个指定ClickHouse Keeper节点数的仲裁。在本例中,我们将创建一个数据库、一个表和一个分布式表,它们将能够查询两个节点上的数据。
Environment(环境)
Architecture Diagram(架构图)
在生产环境中,官方是强烈建议ClickHouse Keeper在专用主机上运行。
Editing configuration files(编辑配置文件)
最佳实践,通过添加或编辑配置文件配置ClickHouse Server时,你应该:
将文件添加到/etc/clickhouse服务器/config.d/目录
将文件添加到/etc/clickhouse服务器/users.d/目录
保持/etc/clickhouse服务器/config.xml文件不变
保持/etc/clickhouse server/users.xml文件不变
chnode1 configuration
对于chnode1,有五个配置文件。可以选择将这些文件合并为一个文件,但为了文档的清晰性,单独查看它们可能更简单。当你阅读配置文件时,你会发现chnode1和chnode2之间的大部分配置都是相同的;差异将被突出显示。
Network and logging configuration(网络和日志配置)
#所有的参数配置说明:https://clickhouse.com/docs/en/operations/server-configuration-parameters/settings
这些值可以根据需要进行自定义。此示例配置为您提供了一个调试日志,该日志将以1000M的大小切割滚动三次。ClickHouse将在端口8123和9000上监听IPv4网络,并将使用端口9009进行服务器间通信。network-and-logging.xml on chnode1
<clickhouse>
   <logger>
     <!--日志级别,none(关闭输出)/fatal(致命)/critical(关键)/error/warning/notice(通知)/information/debug/trace/test(不用于生产)-->
     <level>debug</level>
     <log>/var/log/clickhouse-server/clickhouse-server.log</log>
     <errorlog>/var/log/clickhouse-server/clickhouse-server.err.log</errorlog>
     <size>1000M</size>
     <count>3</count>
   </logger>
   <!--这个名称将显示在clickhouse-client中。默认情况下,任何带有"production"的内容都将在查询提示符中以红色突出显示。-->
   <display_name>clickhouse</display_name>
   <listen_host>0.0.0.0</listen_host>
   <!--HTTP API的端口。这个接口也被ODBC和JDBC驱动程序(DataGrip, Dbeaver,…)使用。以及大多数web界面(嵌入式UI、Grafana、Redash等)。-->
   <http_port>8123</http_port>
   <!--通过本机协议与以下设备进行交互的端口:clickhouse-client/clickhouse-server/ClickHouse驱动程序和支持本机协议的应用程序 -->
   <tcp_port>9000</tcp_port>
   <!--副本之间通信的端口。用于数据交换。它提供服务器之间的 low-level数据访问。此端口不应从不受信任的网络访问。-->
   <interserver_http_port>9009</interserver_http_port>
</clickhouse>
ClickHouse Keeper configuration(ClickHouse Keeper得配置)
ClickHouse Keeper为数据复制和分布式DDL查询执行提供了协调系统。ClickHouse Keeper与Apache ZooKeeper兼容。此配置在端口9181上启用ClickHouse Keeper。突出显示的行指定此Keeper实例的server_id为1。这是三台服务器上enable-keeper.xml文件的唯一区别。chnode2的server_id将设置为2,chnode3的server_id设置为3。raft配置部分在所有三台服务器上都是相同的,下面突出显示的是raft配置中server_id和服务器实例之间的关系。
如果出于任何原因替换或重建了Keeper节点,请不要重用现有的server_id。例如,如果重建了server_id为2的Keeper节点,则将其设置为server_id为4或更高。enable-keeper.xml on chnode1
#文件中的配置含义在:https://clickhouse.com/docs/en/guides/sre/keeper/clickhouse-keeper#keeper-configuration-settings
<clickhouse>
  <keeper_server>
    <!--客户端连接的端口-->
    <tcp_port>9181</tcp_port>
    <!--唯一的服务器id, ClickHouse Keeper集群的每个参与者必须有一个唯一的数字(1、2、3,等等)。-->
    <server_id>1</server_id>
    <!--协调日志的路径,就像ZooKeeper一样,最好将日志存储在非繁忙节点上。-->
    <log_storage_path>/var/lib/clickhouse/coordination/log</log_storage_path>
    <!--coordination快照的路径-->
    <snapshot_storage_path>/var/lib/clickhouse/coordination/snapshots</snapshot_storage_path>

    <coordination_settings>
        <!--单个客户端操作的超时时间(ms),默认值是10000-->
        <operation_timeout_ms>10000</operation_timeout_ms>
        <!--客户端会话最小超时时间(ms),默认值是10000-->
        <session_timeout_ms>30000</session_timeout_ms>
        <!--coordination的文本日志级别-->
        <raft_logs_level>trace</raft_logs_level>
    </coordination_settings>

    <raft_configuration>
        <server>
            <!--仲裁中的服务器标识符。-->
            <id>1</id>
            <!--服务器所在的主机名-->
            <hostname>chnode1</hostname>
            <!--此服务器侦听连接的端口-->
            <port>9234</port>
        </server>
        <server>
            <id>2</id>
            <hostname>chnode2</hostname>
            <port>9234</port>
        </server>
        <server>
            <id>3</id>
            <hostname>chnode3</hostname>
            <port>9234</port>
        </server>
    </raft_configuration>
  </keeper_server>
</clickhouse>
Macros configuration(宏配置)
宏分片和副本降低了分布式DDL的复杂性。配置的值会在DDL查询中自动替换,从而简化DDL。此配置的宏指定了每个节点的分片和副本编号。在这个2分片1副本的示例中,由于只有一个副本,因此副本宏在chnode1和chnode2上都是replica_1。分片宏在chnode1上为1,在chnode2上为2。
macros.xml on chnode1
<clickhouse>
  <macros>
    <shard>1</shard>
    <replica>replica_1</replica>
  </macros>
</clickhouse>
Replication and sharding configuration(副本和分配配置)
从上面开始:
XML的remote_servers部分指定了环境中的每个集群。replace=true属性将默认ClickHouse配置中的示例remote_servers替换为此文件中指定的remote_server配置。如果没有此属性,默认情况下,此文件中的远程服务器将附加到示例列表中。
在这个例子中,有一个名为cluster_2S_1R的集群。
为名为cluster_2S_1R的集群创建一个secret,其值为mysecretphrase。secret在环境中的所有远程服务器之间共享,以确保将正确的服务器连接在一起。
集群cluster_2S_1R有两个分片,每个分片有一个副本。看一下本文开头的架构图,并将其与下面XML中的两个分片定义进行比较。在每个分片定义中都有一个副本。副本是针对该特定分片的。指定该副本的主机和端口。配置中第一个分片的副本存储在chnode1上,第二个分片的副本存储在chnode2上。
将分片的内部复制设置为true。每个shard都可以在配置文件中定义internal_replication参数。如果该参数设置为true,则写操作将选择第一个健康副本并向其写入数据。remote-servers.xml on chnode1
<clickhouse>
  <remote_servers replace="true">
    <cluster_2S_1R>
    <secret>mysecretphrase</secret>
        <shard>
            <!--可选的。是否只向其中一个副本写入数据。默认值:false(向所有副本写入数据)。-->
            <internal_replication>true</internal_replication>
            <replica>
                <host>chnode1</host>
                <port>9000</port>
            </replica>
        </shard>
        <shard>
            <internal_replication>true</internal_replication>
            <replica>
                <host>chnode2</host>
                <port>9000</port>
            </replica>
        </shard>
    </cluster_2S_1R>
  </remote_servers>
</clickhouse>
Configuring the use of Keeper(配置Keeper的使用)
上面配置了几个文件ClickHouse Keeper。此配置文件use-keeper.xml正在将ClickHouse Server配置为使用ClickHouse keeper来协调复制和分布式DDL。此文件指定ClickHouse服务器应在端口9181上的节点chnode1-3上使用Keeper,并且chnode1和chnode2上的文件相同。use-keeper.xml on chnode1
<clickhouse>
    <zookeeper>
        <node index="1">
            <host>chnode1</host>
            <port>9181</port>
        </node>
        <node index="2">
            <host>chnode2</host>
            <port>9181</port>
        </node>
        <node index="3">
            <host>chnode3</host>
            <port>9181</port>
        </node>
    </zookeeper>
</clickhouse>
chnode2 configuration
network-and-logging.xml on chnode2(无变化)
enable-keeper.xml on chnode2 #只记录变化的地方
<server_id>2</server_id>
macros.xml on chnode2 #只记录变化的地方
<shard>2</shard>
remote-servers.xml on chnode2 #无变化
use-keeper.xml on chnode2 #无变化
chnode3 configuration
由于chnode3不存储数据,仅用于ClickHouse Keeper提供仲裁中的第三个节点,所以安装的软件和配置文件也有所不同:
#yum install clickhouse-keeper -y
# vim /etc/clickhouse-keeper/keeper_config.xml
<clickhouse>
    <logger>
        <level>error</level>
        <log>/var/log/clickhouse-keeper/clickhouse-keeper.log</log>
        <errorlog>/var/log/clickhouse-keeper/clickhouse-keeper.err.log</errorlog>
        <size>1000M</size>
        <count>3</count>
    </logger>
    <listen_host>0.0.0.0</listen_host>
    <keeper_server>
        <tcp_port>9181</tcp_port>
        <server_id>3</server_id>
        <log_storage_path>/var/lib/clickhouse/coordination/log</log_storage_path>
        <snapshot_storage_path>/var/lib/clickhouse/coordination/snapshots</snapshot_storage_path>
        <coordination_settings>
            <operation_timeout_ms>10000</operation_timeout_ms>
            <session_timeout_ms>30000</session_timeout_ms>
            <raft_logs_level>trace</raft_logs_level>
        </coordination_settings>
        <raft_configuration>
            <server>
                <id>1</id>
                <hostname>192.168.1.164</hostname>
                <port>9234</port>
            </server>
            <server>
                <id>2</id>
                <hostname>192.168.1.165</hostname>
                <port>9234</port>
            </server>
            <server>
                <id>3</id>
                <hostname>192.168.1.166</hostname>
                <port>9234</port>
            </server>
        </raft_configuration>
    </keeper_server>
</clickhouse>
# mkdir /var/lib/clickhouse-keeper && chown clickhouse:clickhouse /var/lib/clickhouse-keeper
# systemctl restart clickhouse-keeper
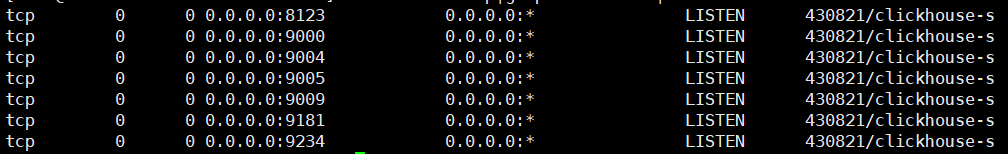
# ps aux|grep click
/usr/bin/clickhouse-keeper --config=/etc/clickhouse-keeper/keeper_config.xml --pid-file=/run/clickhouse-keeper/clickhouse-keeper.pid
# netstat -lntup|grep click
tcp        0      0 0.0.0.0:9181            0.0.0.0:*               LISTEN      29561/clickhouse-ke
tcp6       0      0 :::9234                 :::*                    LISTEN      29561/clickhouse-ke
测试:
#按照上面在1/2台机器上面配置一下,我这里直接用的IP省的配置hosts了,执行一下:/etc/init.d/clickhouse-server restart 就可以关注三台服务器的进程是否启动了。
#特别注意,clickhouse-server的启动出错提示比较少,如果你的服务一直等待启动Waiting for server to start可以看看配置文件和指定的目录是不是clickhouse用户授权,或者配置文件肯定是有改动错误的地方,如果觉得日志刷的太狠了,可以把日志级别调一下
#每个机器都可以执行一下# echo mntr | nc 127.0.0.1 9181 可以看zk_server_state这个字段会显示leader还是follower
# ps -aux|grep clickhouse #先看下进程
# netstat -lntup|grep clickhouse|sort -k 3 #再查看下监听端口
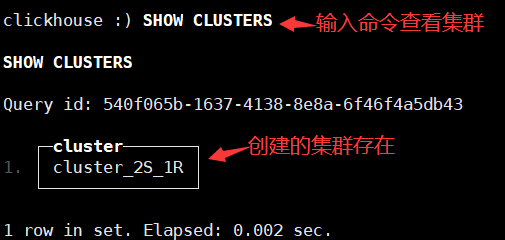
1.连接到chnode1并验证上面配置的集群cluster_2S_1R是否存在
# clickhouse-client #默认是没有密码的,默认只有default用户,可以在users.xml这里为这个用户设置密码,比如<password>123456</password>
2.在集群上创建数据库
CREATE DATABASE db1 ON CLUSTER cluster_2S_1R;
3.在集群上使用MergeTree表引擎创建表
#我们不需要在表引擎上指定参数,因为这些参数将根据我们的宏自动定义
CREATE TABLE db1.table1 ON CLUSTER cluster_2S_1R
(
    `id` UInt64,
    `column1` String
)
ENGINE = MergeTree
ORDER BY id
4.连接到chnode1并插入一行
INSERT INTO db1.table1 (id, column1) VALUES (1, 'abc');
5.连接到chnode2并插入一行
INSERT INTO db1.table1 (id, column1) VALUES (2, 'def');
6.连接到任一节点chnode1或chnode2,将只看到该节点上插入该表的行。例如,在chnode2上什么都查不到,因为是在chnode1上面做的操作
SELECT * FROM db1.table1;
7.创建一个分布式表来查询两个节点上的两个分片。(在本例中,rand()函数被设置为分片键,因此它随机分配每次插入)
CREATE TABLE db1.table1_dist ON CLUSTER cluster_2S_1R
(
    `id` UInt64,
    `column1` String
)
ENGINE = Distributed('cluster_2S_1R', 'db1', 'table1', rand())
#为什么先创建本地表再创建分布式表?
Clickhouse是分布式系统,先在每个Shard 每个节点上创建本地表(即 Shard 的副本),本地表只在对应节点内可见;然后再创建分布式表[Distributed],映射到前面创建的本地表。用户在访问分布式表时,ClickHouse 会自动根据集群架构信息,把请求转发给对应的本地表。
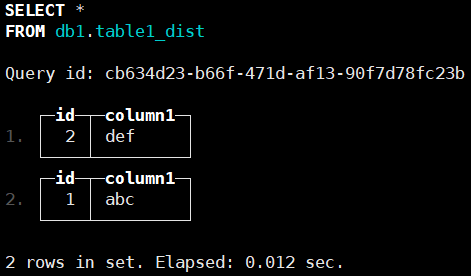
8.连接到chnode1或chnode2,查询分布式表以查看插入的数据,两个节点查看到的数据是一致的了。
SELECT * FROM db1.table1_dist;
博文来自:www.51niux.com
2.3 Replication for fault tolerance(容错复制)
在此架构中,配置了五台服务器。两个用于托管数据副本。其他三台服务器用于协调数据的复制。通过这个例子,我们将创建一个数据库和表,使用ReplicatedMergeTree表引擎在两个数据节点之间复制。
clickhouse-01 configuration
# vim /etc/clickhouse-server/config.d/network-and-logging.xml
<clickhouse>
    <logger>
        <level>debug</level>
        <log>/var/log/clickhouse-server/clickhouse-server.log</log>
        <errorlog>/var/log/clickhouse-server/clickhouse-server.err.log</errorlog>
        <size>1000M</size>
        <count>3</count>
    </logger>
    <!--连接clickhouse-client时显示的名称为cluster_1S_2R node 1-->
    <display_name>cluster_1S_2R node 1</display_name>
    <listen_host>0.0.0.0</listen_host>
    <http_port>8123</http_port>
    <tcp_port>9000</tcp_port>
</clickhouse>
# vim /etc/clickhouse-server/config.d/macros.xml
macros shard and replica降低了分布式DDL的复杂性。配置的值会在DDL查询中自动替换,从而简化DDL。此配置的宏指定了每个节点的分片和副本编号。
在这个1分片2副本的示例中,replica macro在clickhouse-01上是replica_1,在clickhouse-02上是replica _2。在clickhouse-01和clickhouse-02上,shard macro都是1,因为只有一个分片。
<clickhouse>
    <macros>
        <shard>01</shard>
        <replica>01</replica>
        <cluster>cluster_1S_2R</cluster>
    </macros>
</clickhouse>
# vim /etc/clickhouse-server/config.d/remote-servers.xml
<clickhouse>
    <remote_servers replace="true">
        <cluster_1S_2R>
            <secret>mysecretphrase</secret>
            <shard>
                <internal_replication>true</internal_replication>
                <replica>
                    <host>192.168.1.164</host>
                    <port>9000</port>
                </replica>
                <replica>
                    <host>192.168.1.165</host>
                    <port>9000</port>
                </replica>
            </shard>
        </cluster_1S_2R>
    </remote_servers>
</clickhouse>
# vim /etc/clickhouse-server/config.d/use-keeper.xml #指定使用哪三台clickhouse-keeper节点
<clickhouse>
    <zookeeper>
        <!-- where are the ZK nodes -->
        <node>
            <host>192.168.1.166</host>
            <port>9181</port>
        </node>
        <node>
            <host>192.168.1.167</host>
            <port>9181</port>
        </node>
        <node>
            <host>192.168.1.168</host>
            <port>9181</port>
        </node>
    </zookeeper>
</clickhouse>
clickhouse-02 configuration
#只列出差异部分
# vim /etc/clickhouse-server/config.d/network-and-logging.xml
<display_name>cluster_1S_2R node 2</display_name>
# vim /etc/clickhouse-server/config.d/macros.xml
<replica>02</replica>
clickhouse-keeper-01 configuration
ClickHouse Keeper为数据复制和分布式DDL查询的执行提供了协调系统。ClickHouse Keeper与Apache ZooKeeper兼容。此配置在端口9181上启用ClickHouse Keeper。突出显示的行指定此Keeper实例的server_id为1。这是三个服务器之间enable-keeper.xml文件的唯一不同之处。Clickhouse-keeper-02将有server_id设置为2,clickhouse-keeper-03将有server_id设置为3。
#配置文件/etc/clickhouse-keeper/keeper_config.xml参照前面的配置文件吧就server_id地方node1是1,node2是2,node3是3就行了。
clickhouse-keeper-02 configuration
<server_id>2</server_id>
clickhouse-keeper-03 configuration
<server_id>3</server_id>
测试
使用一个shell中的clickhouse客户端连接到节点clickhouse-01,并使用另一个shell的clickhouse客户机连接到节点clickhouse-02。
1.在上面配置的集群上创建数据库
cluster_1S_2R node 1 :) CREATE DATABASE db2 ON CLUSTER cluster_1S_2R;
2.使用ReplicatedMergeTree表引擎在数据库上创建表
CREATE TABLE db2.table1 ON CLUSTER cluster_1S_2R
(
    `id` UInt64,
    `column1` String
)
ENGINE = ReplicatedMergeTree
ORDER BY id
3.在node1结点上面插入数据,在node2节点上面查询,发现是可以查询到数据的,反之亦然
INSERT INTO db2.table1 (id, column1) VALUES (1, 'abc');
SELECT * FROM db2.table1;
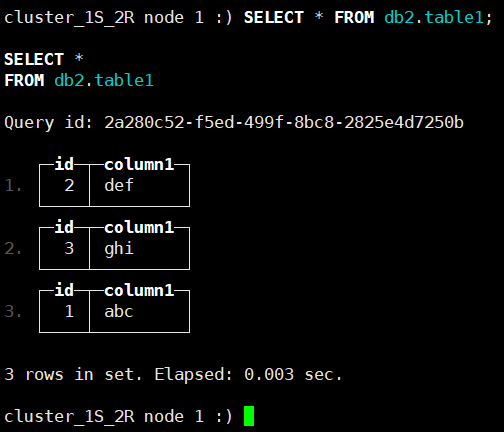
4.现在我们通过命令# /etc/init.d/clickhouse-server stop 把node1节点停掉,然后在node2上面执行命令插入一条数据,然后再查看一下会发现三条数据都是在的
cluster_1S_2R node 2 :) INSERT INTO db2.table1 (id, column1) VALUES (3, 'ghi');
cluster_1S_2R node 2 :) SELECT * FROM db2.table1;
5.将停掉的node1启动起来# /etc/init.d/clickhouse-server start,然后在上面查询一下,会发现数据也是全的,因为每个Node节点都是全量数据:
cluster_1S_2R node 1 :) SELECT * FROM db2.table1;
2.4 Sizing and Hardware Recommendations(规模和硬件建议)
详细的看:https://clickhouse.com/docs/en/guides/sizing-and-hardware-recommendations
这里就列下内存说明:
内存与存储的比率应该是多少?
对于低数据量,1:1的内存与存储比是可以接受的,但总内存不应低于8GB。
对于数据保留期较长或数据量较大的用例,建议采用1:100至1:130的内存与存储比。例如,如果要存储10TB的数据,则每个副本需要100GB的RAM。
对于频繁访问的用例,例如面向客户的工作负载,建议以1:30到1:50的内存与存储比率使用更多内存。
2.5 List of tools and utilities(工具和实用程序列表)
clickhouse-local #允许在不启动ClickHouse服务器的情况下对数据运行SQL查询,类似于awk的做法
clickhouse-benchmark #用自定义查询和设置加载服务
clickhouse-format #支持格式化输入查询
ClickHouse obfuscator #混淆数据
ClickHouse compressor #压缩和解压缩数据
clickhouse-disks #在不同ClickHouse磁盘之间的文件上提供类似文件系统的操作
clickhouse-odbc-bridge #ODBC驱动程序的代理服务器
clickhouse_backupview #分析ClickHouse备份的python模块
三、性能监控
ClickHouse 从 v20.1.2.4 开始,内置了对接 Prometheus 的功能,可以将其作为 Prometheus 的 Endpoint 服务,从而自动的将 metrics、events 和 asynchronous_metrics(主要用于统计服务运行过程的时候,当前正在后台异步运行的信息) 三张系统的表的数据发送给 Prometheus。
cluster_1S_2R node 1 :) select count(*) from system.metrics;
cluster_1S_2R node 1 :) select count(*) from system.events;
cluster_1S_2R node 1 :) select count(*) from system.asynchronous_metrics;
3.1 ClickHouse开启内置的endpoint功能
# vim /etc/clickhouse-server/config.xml #将关于prometheus的注释部分去掉并重启服务
    <prometheus>
        <endpoint>/metrics</endpoint>
        <port>9363</port>

        <metrics>true</metrics>
        <events>true</events>
        <asynchronous_metrics>true</asynchronous_metrics>
    </prometheus>
#curl 127.0.0.1:9363/metrics |more #可以查看一下都有哪些指标,不过指标太多了不到2000个所以加了个more,后面可以只保留一些需要的指标
3.2 prometheus配置采集
# vim /opt/soft/prometheus/prometheus.yml #新增job_name,并重新加载
    - job_name: 'clickhouse'
      static_configs:
        - targets: ['192.168.1.164:9363','192.168.1.165:9363']
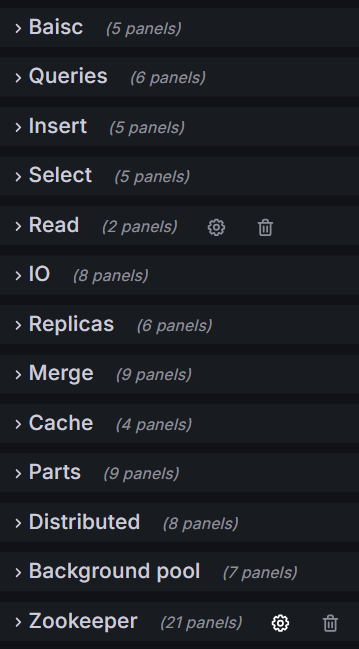
3.3 grafana出图展示
#去官网上面找一个模版下载下来,以prometheus为数据源自己修改修改
博文来自:www.51niux.com
4、日志采集
clickhouse集群部署起来了,我们得往里面写入些数据啊,比如我们把nginx的日志存储进去进行分析。这里使用Vector+ClickHouse来采集Nginx日志并做清洗,最终插入到clickhouse存储起来。Vector 是一个用于构建数据传输 pipeline 的工具。它开箱即用支持 ClickHouse。使用 Vector Remap Language (VRL) 可以对日志进行清洗,把非结构化的数据清洗成结构化数据。
官网文档:https://vector.dev/docs/
4.1 Vector 安装
#wget https://packages.timber.io/vector/0.39.0/vector-0.39.0-x86_64-unknown-linux-gnu.tar.gz
#tar xf vector-0.39.0-x86_64-unknown-linux-gnu.tar.gz
#cp -rf /opt/soft/package/vector-x86_64-unknown-linux-gnu /opt/soft/vector
# cd /opt/soft/vector/
./bin/vector --version #执行下命令看看会不会报错
vector 0.39.0 (x86_64-unknown-linux-gnu......)
我们先看下我们当前的nginx日志格式:
    log_format  main  '$http_host $remote_addr - $remote_user $time_iso8601 '
                      '$scheme "$request" $status $bytes_sent "$http_referer" '
                      '"$http_user_agent" "$http_x_forwarded_for" "$gzip_ratio" $request_time '
                      '$upstream_addr $upstream_status $upstream_response_time';
我们先什么都不做处理,先把nginx的日志采集一下
#然后需要先在clickhouse上面创建对应的数据库和表:
cluster_1S_2R node 1 :) CREATE DATABASE nginxdb  ON CLUSTER cluster_1S_2R;
cluster_1S_2R node 1 :) CREATE TABLE nginxdb.access_logs ON CLUSTER cluster_1S_2R (message String) ENGINE = MergeTree() ORDER BY tuple();
然后配置nginx上面的vector的配置文件进行日志采集:
# cat /opt/soft/vector/config/test/nginx.yaml #先不做任何过滤,先把日志采集一下
data_dir: "/var/log/vector"
sources:
  nginx_logs:
    type: "file"
    include: [ "/opt/log/nginx/app.test.cn/app.test.cn_access.log" ]
    read_from: "end"

sinks:
  clickhouse:
    type: "clickhouse"
    inputs: ["nginx_logs"]
    endpoint: "http://192.168.1.164:8123"
    database: "nginxdb"
    table: "access_logs"
    skip_unknown_fields: true
    auth:
      user: default
      password: "123456"
      strategy: basic
4.2 构建物理视图
我们先查看一下采集上来的数据
cluster_1S_2R node 1 :) select * from nginxdb.access_logs limit 2\G
下面是查询结果:
SELECT *
FROM nginxdb.access_logs
LIMIT 2

Query id: e67245bf-2509-4623-840f-45fc0a0c4b72

Row 1:
──────
message: app.test.cn 123.199.53.68 - - 2024-05-26T11:13:28+08:00 http "POST /app/uplog/ HTTP/1.1" 200 402 "-" "Dalvik/2.1.0 (Linux; U; Android 10; VCE-AL00 Build/HUAWEIVCE-AL00)" "-" "-" 0.014 192.168.1.228:38007 200 0.013

Row 2:
──────
message: app.test.cn 123.199.53.69 - - 2024-05-26T11:14:14+08:00 http "POST /app/uplog/ HTTP/1.1" 200 402 "-" "Dalvik/2.1.0 (Linux; U; Android 10; PBDM00 Build/QKQ1.190918.001)" "-" "-" 0.004 192.168.1.228:38007 200 0.004

2 rows in set. Elapsed: 0.002 sec.
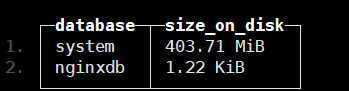
创建物理视图之前记录下数据库大小(先采集了几十条数据vector先停止了):
cluster_1S_2R node 1 :) select database,formatReadableSize(sum(bytes_on_disk)) AS size_on_disk FROM system.parts WHERE active GROUP BY database ORDER BY size_on_disk DESC
现在开始创建物理视图:
CREATE MATERIALIZED VIEW nginxdb.access_logs_view
(
HttpHost String,
RemoteAddr String,
Client String,
RemoteUser String,
TimeLocal DateTime,
HttpProtocol String,
RequestMethod String,
Request_Url String,
HttpVersion String,
Status Int32,
BytesSent Int64,
Http_Referer String,
UserAgent String,
Forwarded_For String,
Gzip_Ratio String,
Request_Time Float32,
Upstream_Addr String,
Upstream_Status String,
Upstream_Response_Time Float32
)
ENGINE = MergeTree()
ORDER BY RemoteAddr
POPULATE AS
WITH
splitByWhitespace(message) as split,
splitByRegexp('\S \d+ "(^"]*)"', message) as referer,
splitByRegexp('[)]',trim(BOTH '" ' from splitByRegexp('\S \d+ "([^"]*)"', message)[2])) as referer2,
splitByWhitespace(splitByRegexp('[)]',message)[2]) as referer3
SELECT
split[1] AS HttpHost,
split[2] AS RemoteAddr,
split[3] AS Client,
split[4] AS RemoteUser,
parseDateTimeBestEffort(split[5]) AS TimeLocal,
trim(LEADING '"' FROM split[6]) AS HttpProtocol,
split[7] AS RequestMethod,
split[8] AS Request_Url,
split[9] AS HttpVersion,
split[10] AS Status,
split[11] AS BytesSent,
split[12] AS Http_Refere,
concat(referer2[1] AS UserAgent,')'),
referer3[2] AS Forwarded_For,
referer3[3] AS Gzip_Ratio,
toFloat32OrZero(referer3[4]) AS Request_Time,
referer3[5] AS Upstream_Addr,
referer3[6] AS Upstream_Status,
toFloat32OrZero(referer3[7]) AS Upstream_Response_Time
FROM
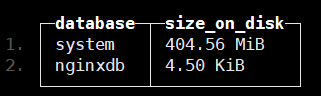
(SELECT message FROM nginxdb.access_logs)#我们再查看一下创建完物理视图后数据库的大小
博文来自:www.51niux.com
#所以可以看出,ClickHouse 中物化视图(Materialized View)是一种预先计算并缓存结果的视图,它存储在磁盘上并自动更新,典型的空间换时间思路。物化视图是一种优化技术,它可以加速查询操作,降低系统负载,并提高查询性能。
#上面的sql语句为什么要是toFloat32OrZero而不是toFloat32呢?是因为如果user_agent并不是所有的都是()包起来的,还有其他形式,那么你的取值就会不完整就会导致后面得数都取不出来了,string格式倒是没事大不了就空嘛,但是这种浮点数的就会报错,下面看看不同效果的展示
Row 5:
-------------
UserAgent:    Dalvik/2.1.0 (Linux; U; Android 10; PBDM00 Build/QKQ1.190918.001)
Forwarded_For:  "-"
Gzip_Ratio:   "-"
Request_Time:  0.004
Upstream_Addr:  192.168.1.228:38007
Upstream_Status:   200
Upstream_Response_Time: 0.004
Row 6:
──────
UserAgent:  Driver/1 CFNetwork/1408.0.4 Darwin/22.5.0" "-" "-" 0.009 192.168.1.228:38007 200 0.009)
Forwarded_For:
Gzip_Ratio:
Request_Time: 0
Upstream_Addr:
Upstream_Status:
Upstream_Response_Time: 0
#别的字段还好,都是单个字段,user_agent比较复杂是由多个字段构成的。
第一种解决办法:将user_agent放到最后,然后sql就变成了,这里只展示差异部分
WITH
    splitByWhitespace(message) as split,
    splitByRegexp('\S \d+ "([^"]*)"', message) as referer
SELECT
    ......
        trim(BOTH '"' from referer[2]) AS UserAgent
#但是上面的这种方式显然不太友好,一般日志记录并不会把user_agent放到最后,这就改变了我们的传统查看习惯。
第二种解决办法:就是在nginx的日志格式中[user_agent]这样包一下,这样就可以正则切割的特殊标识了。
    log_format  main  '$http_host $remote_addr - $remote_user $time_iso8601 '
                      '$scheme "$request" $status $bytes_sent "$http_referer" '
                      '"[$http_user_agent]" "$http_x_forwarded_for" "$gzip_ratio" $request_time '
                      '$upstream_addr $upstream_status $upstream_response_time';
# /opt/soft/vector/bin/vector --config /opt/soft/vector/config/test/nginx.yaml #重新采集一下
再看现在的日志格式就发生了变化:
app.test.cn 123.199.53.68 - - 2024-05-27T16:25:58+08:00 https "POST /app/uplog/ HTTP/1.1" 200 402 "-" "[Dalvik/2.1.0 (Linux; U; Android 12; LIO-AL00 Build/HUAWEILIO-AL00)]" "-" "-" 0.002 192.168.1.228:38007 200 0.001
app.test.cn 123.199.53.67- - 2024-05-27T16:26:40+08:00 http "POST /app/uplog/ HTTP/1.1" 200 402 "-" "[Dalvik/2.1.0 (Linux; U; Android 12; ANA-AN00 Build/HUAWEIANA-AN00)]" "-" "-" 0.004 192.168.1.228:38007 200 0.004
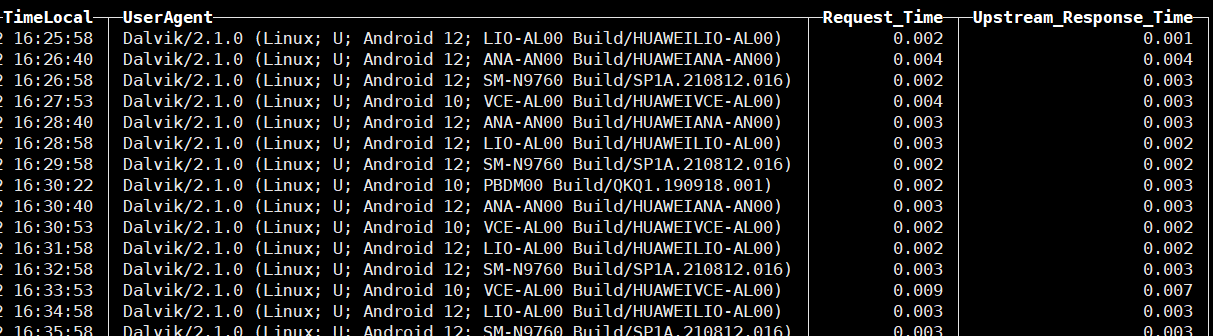
再执行下创建物理视图的sql语句,这次我们以时间排序ORDER BY TimeLocal,之前用IP排序,时间都是乱的看着很别扭:
CREATE MATERIALIZED VIEW nginxdb.access_logs_view
(
    HttpHost String,
    RemoteAddr String,
    TimeLocal DateTime,
    HttpProtocol String,
    RequestMethod String,
    Request_Url String,
    Status Int32,
    BytesSent Int64,
    Http_Referer  String,
    UserAgent String,
    Forwarded_For String,
    Request_Time Float32,
    Upstream_Status String,
    Upstream_Response_Time Float32
)
ENGINE = MergeTree()
ORDER BY TimeLocal
POPULATE AS
WITH
    splitByWhitespace(splitByRegexp('\"\[',message)[1]) as split,
    splitByWhitespace(splitByRegexp('\]\"',message)[2]) as referer3,
    splitByRegexp('[\"\[\]\"]',message) as referer2
SELECT
    split[1] AS HttpHost,
    split[2] AS RemoteAddr,
    parseDateTimeBestEffort(split[5]) AS TimeLocal,
    trim(LEADING '"' FROM split[6]) AS HttpProtocol,
    split[7] AS RequestMethod,
    split[8] AS Request_Url,
    split[10] AS Status,
    split[11] AS BytesSent,
    split[12] AS Http_Refere,
    referer2[7] AS UserAgent,
    referer3[1] AS Forwarded_For,
    toFloat32OrZero(referer3[3]) AS Request_Time,
    referer3[5] AS Upstream_Status,
    toFloat32OrZero(referer3[6]) AS Upstream_Response_Time
FROM
    (SELECT message FROM nginxdb.access_logs)
来查看一下显示效果:
cluster_1S_2R node 1 :) select TimeLocal,UserAgent,Request_Time,Upstream_Response_Time from nginxdb.access_logs_view